Module 1 / Lesson 2.1
Risk and Loss Without Insurance
Connecting our Strategy: In Lesson 1.3 Categories of Risk Management Strategies, we introduced five key risk management strategies. This lesson develops in detail the simplest risky setting in which we can explore these types of risk management.
Learning guide
- Learning: Learn the material below about how to represent insurance within the risk setup we learned in Lesson 1.1.
- Reflection: As you learn this material, make sure you understand how risk manifests in a two-state model when no insurance is available, including with a concrete numeric example
Numeric Example: The Bicycle Theft Scenario
Let's examine a concrete situation to understand how risk affects wealth when there is no insurance protection available:
Scenario Setup:
- You own a bicycle valued at $96
- You have $121 in your savings account
- There is NO insurance available for the bicycle
- There is a risk the bicycle might (or might not) be stolen (requiring spending $96 to replace it)
Two-State Model
Imagine you're walking around with $121 in your bank account and a $96 bicycle that might get stolen. If it gets stolen, you'll have to spend $96 to replace it. You can't predict the future; but you can prepare for it. How do you understand this situation?
Two-State Model: Wealth With and Without Loss
A state just means one of the things that might happen. Here, we use the two‑state model, only two things can happen and exactly one of them will happen:
- No loss: You keep your bike. Your wealth stays at $121.
- Loss: Your bike is stolen and you spend $96 to replace it. You lose $96, leaving you with $121 − $96 = $25.
Side note: Real life has more possibilities (e.g., partial damage). We ignore that complexity here.
The two‑state model has two key variables:
- Initial wealth (W0): In this example, W0 = $121.
- Loss amount (L): In this example, L = $96.
In the language of Lesson 1.1, risk has a frequency, a severity, and a scope:
- The loss amount (L=$96) is the severity.
- The scope is the person whose bike might be stolen.
- The frequency in this situation hasn't been discussed. We haven't said anything about how likely it is that the bike will be stolen, but we will introduce and use this frequency in Lesson 2.3 as we build on this scenario.
Wealth without insurance
- WNoLoss = W0 = $121
- WLoss = W0 − L = $121 − $96 = $25
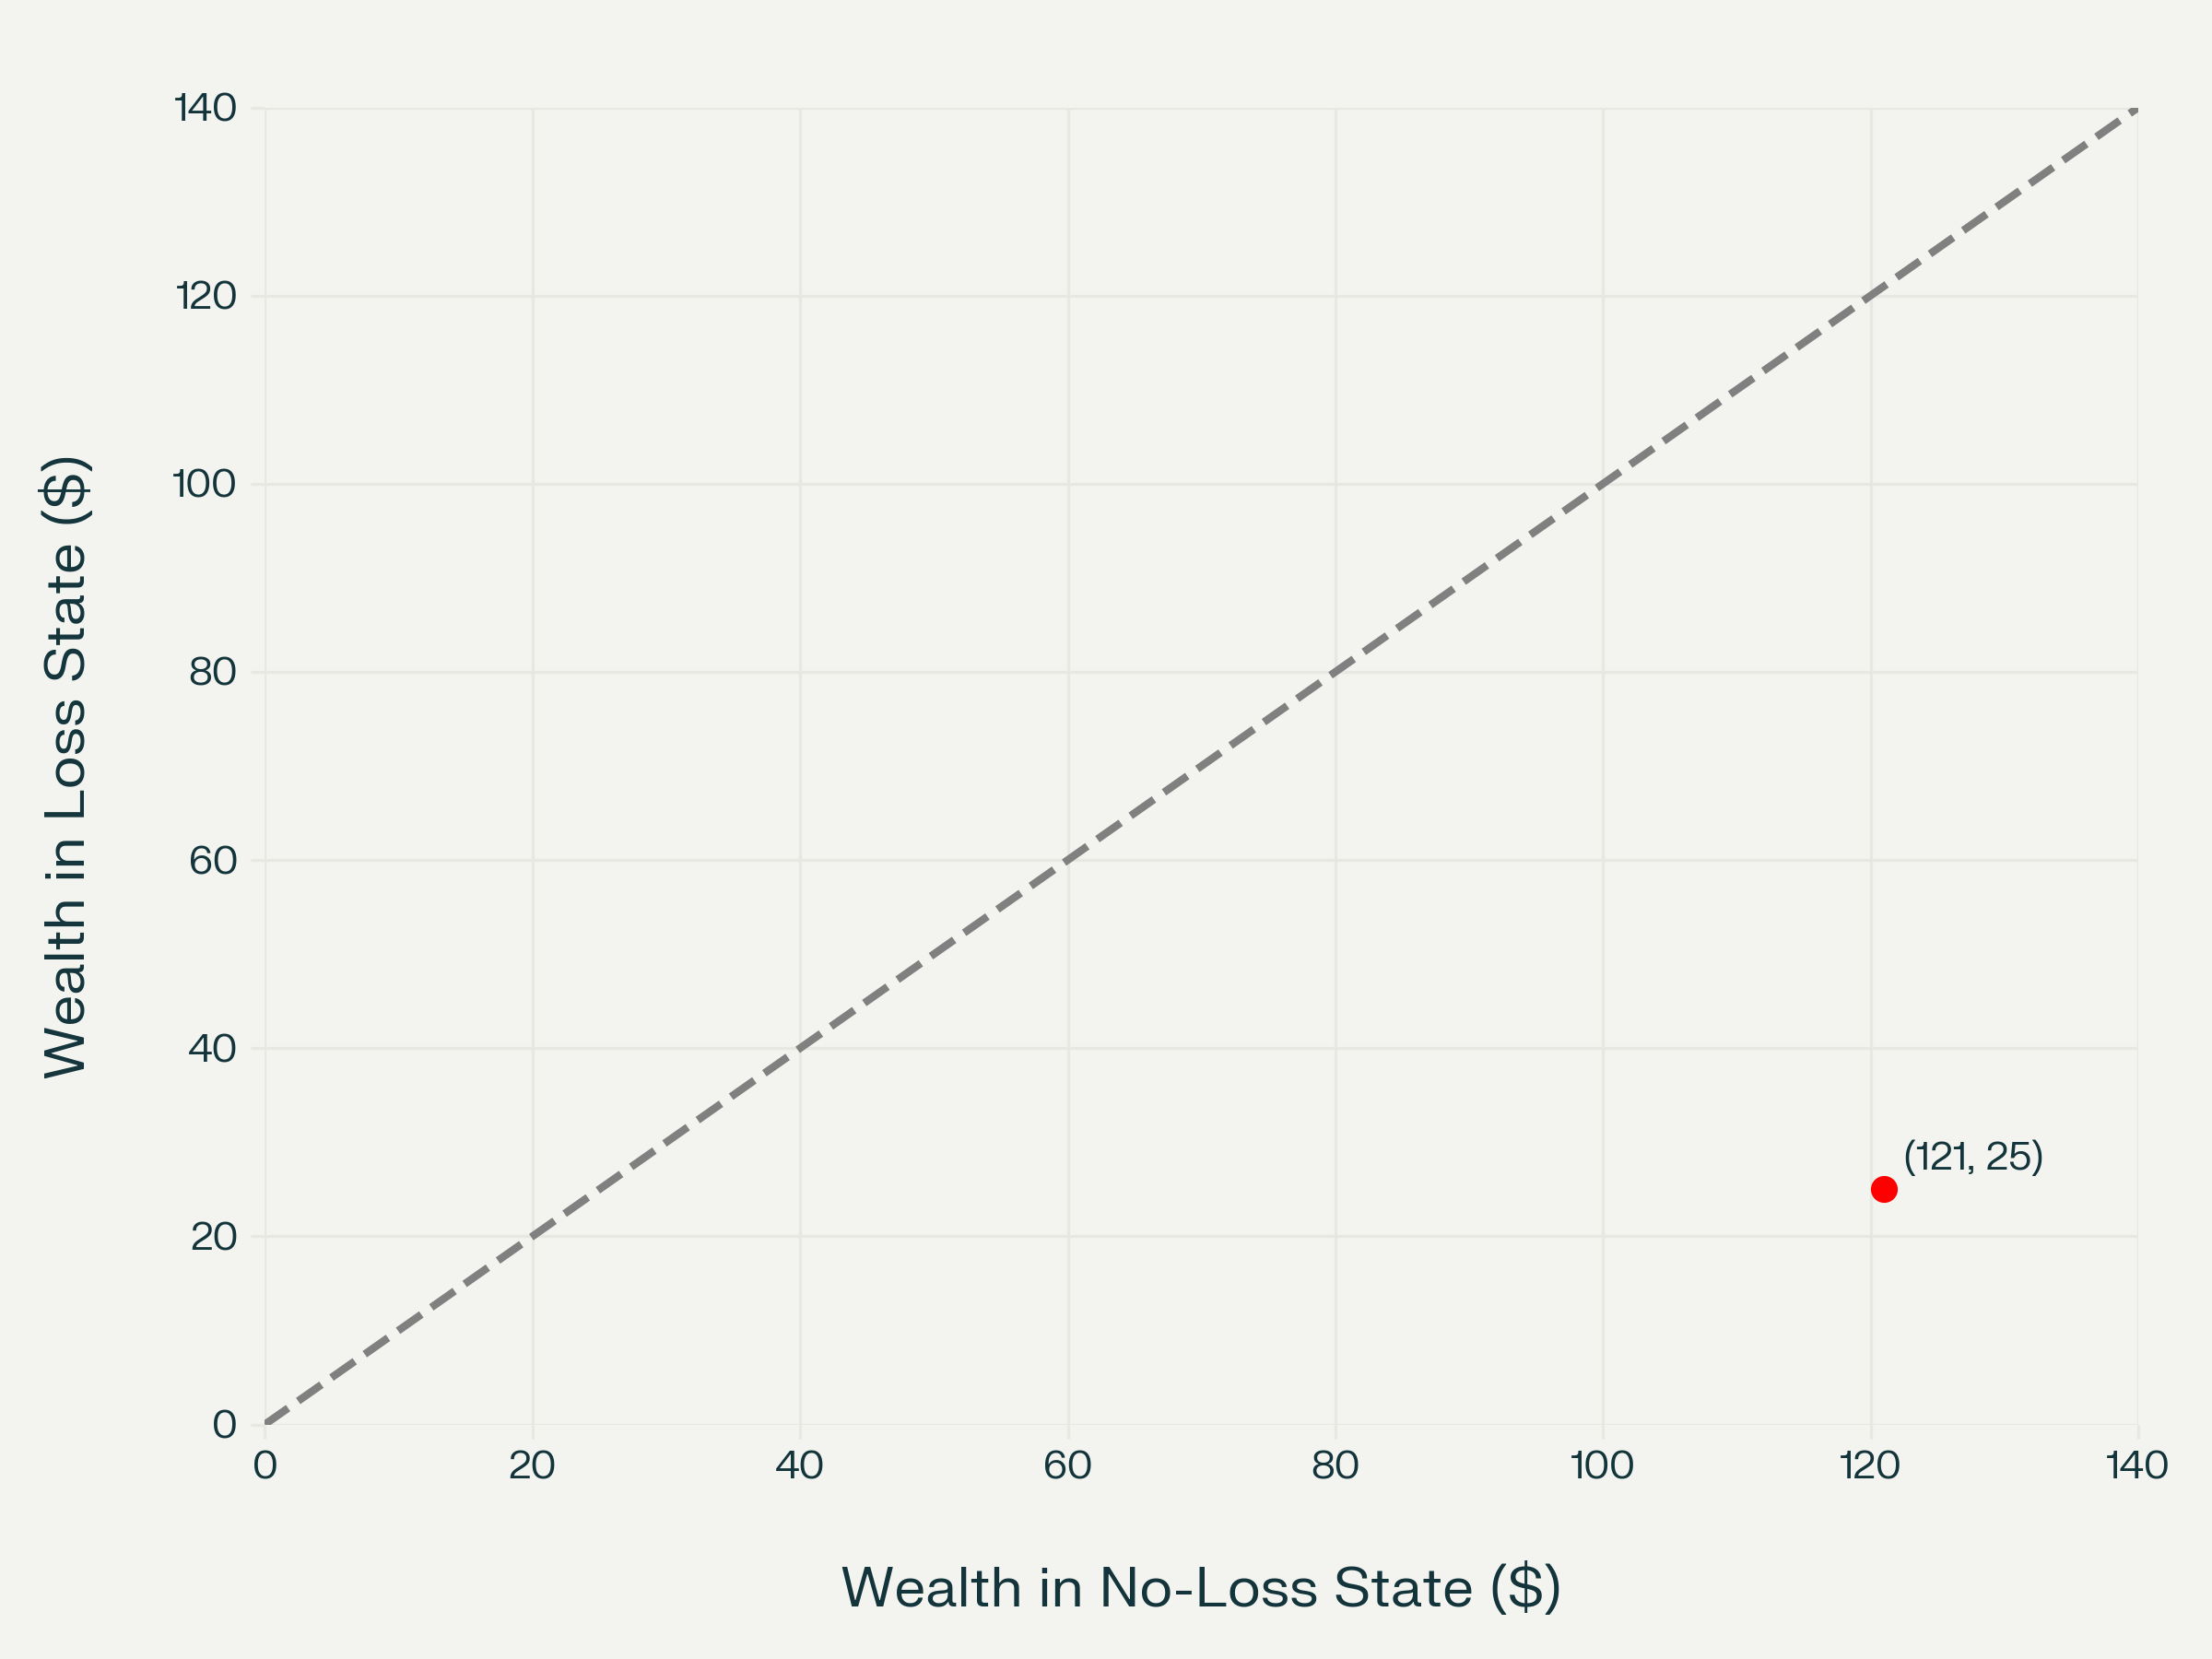
An easy way to visualize this situation before we find out if the bike is stolen is with a two‑state diagram: x‑axis = wealth if no loss, y‑axis = wealth if loss.
Wealth Comparison: Good State vs. Bad State
Key Insight: There is a large gap between states:
- Good State (No Loss): WNoLoss = $121
- Bad State (Loss Occurs): WLoss = $25
- Difference: $121 − $25 = $96 (the loss size)
Graphical Analysis
The graph below shows wealth in the good state (x‑axis) vs. wealth in the bad state (y‑axis). The 45° line represents equal wealth in both states.
Graph Interpretation
- X‑axis: WNoLoss = W0 = 121
- Y‑axis: WLoss = W0 − L = 121 − 96 = 25
- Red Dot: Risky situation with no insurance. coordinates (WNoLoss, WLoss) = (W0, W0 − L) = (121, 121 − 96) = (121, 25)
- 45° Line: Equal wealth in both states. no risk
- Distance from 45° Line: Red dot is far below the line → substantial risk
Video: Understanding Risk Without Insurance
“What happens when there’s risk but no insurance?”