Module 3 / Lesson 8.2
Sources of Climate Change Uncertainty
Distinguishing between scientific and human uncertainty, and learning how to measure tail risks.
8.2.1 Three Drivers of Uncertainty
Reflection: As you read, think about how Emissions Uncertainty (human policy/tech), Climate Sensitivity (physical science), and Human Adaptation (response) interact to determine total risk.
'Sources of Uncertainty' Video
Key Concept: Three Key Drivers of Climate Uncertainty
- 1. Emissions Uncertainty: How much fossil fuel will we burn? (e.g., Will a carbon tax pass? Will fusion work? These determine how much CO₂ enters the atmosphere.)
- 2. Climate Sensitivity: How much will CO₂ change the climate? (e.g., Complex feedback loops like clouds, melting permafrost, and glaciers that are hard to model perfectly.)
- 3. Human Adaptation: How will climate change impact lives? (e.g., Even if warming hits 3°C, the impact depends on our response. Will we build sea walls? Invent drought-resistant crops? Relocate?)
8.2.2 Measuring Risk: Statistics & Tails
Learning: Watch the videos below to understand how statisticians describe the distribution of outcomes, specifically "Tail Risks" which are crucial for existential threats.
Reflection: The UN expects 2.8°C warming, but that is just an average. The true outcome could be much higher (the "tail"). How do we measure that danger zone?
'Measures of Central Tendency or Typical Outcome' Video
Risk Measurement Vocabulary
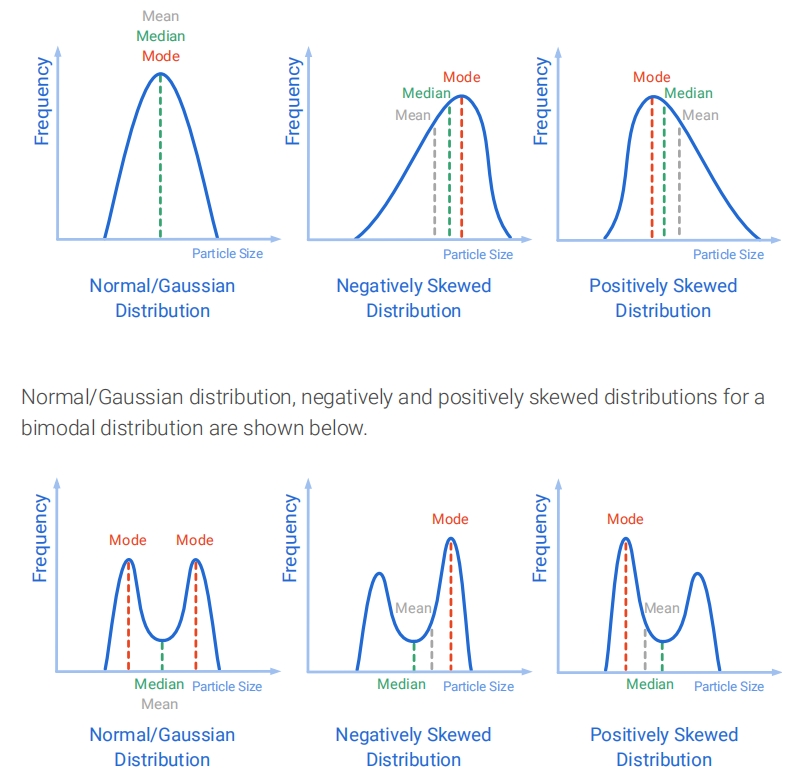
A. Standard Measures (Central Tendency)
- Mean/Average: The weighted average of all possible outcomes.
- Median: The 50th percentile (half outcomes higher, half lower).
- Mode: The single most likely outcome.
- Variance: How spread out the data is.
B. Tail Risk Measures (Crucial for x-Risk)
- Probability of Exceedance: The likelihood damage will be greater than a specific amount (e.g., "1% chance of >10°C warming").
- Value at Risk (VaR): The minimum harm in the worst x% of scenarios (e.g., "In the worst 5% of cases, warming is at least 7°C").
- Expected Shortfall: If we hit that worst 5%, how bad is the average of those bad outcomes? (Measures the depth of the disaster).
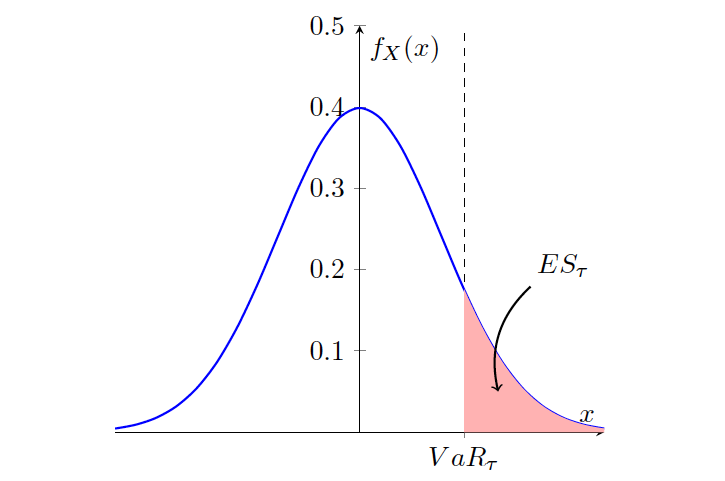
Source: stats.stackexchange.com
'Tail Measures' Video
Your progress stays in this browser.